
Thailand Weather by Month and Region: Rain, Heat, Haze
Thailand has no single wet season. Phuket is driest in February at 24.0 mm and wettest in September at 350.4 mm. Koh Samui peaks in November at 444.6 mm. Bangkok peaks in September and Chiang Mai in August. Chiang Mai has haze on 18.7 to 26.8 days a month from January to March.
On this page
How Thailand’s seasons and monsoons work
The Thai Meteorological Department (TMD) divides the year into three seasons: hot from mid-February to mid-May, rainy from mid-May to mid-October and cool from mid-October to mid-February.
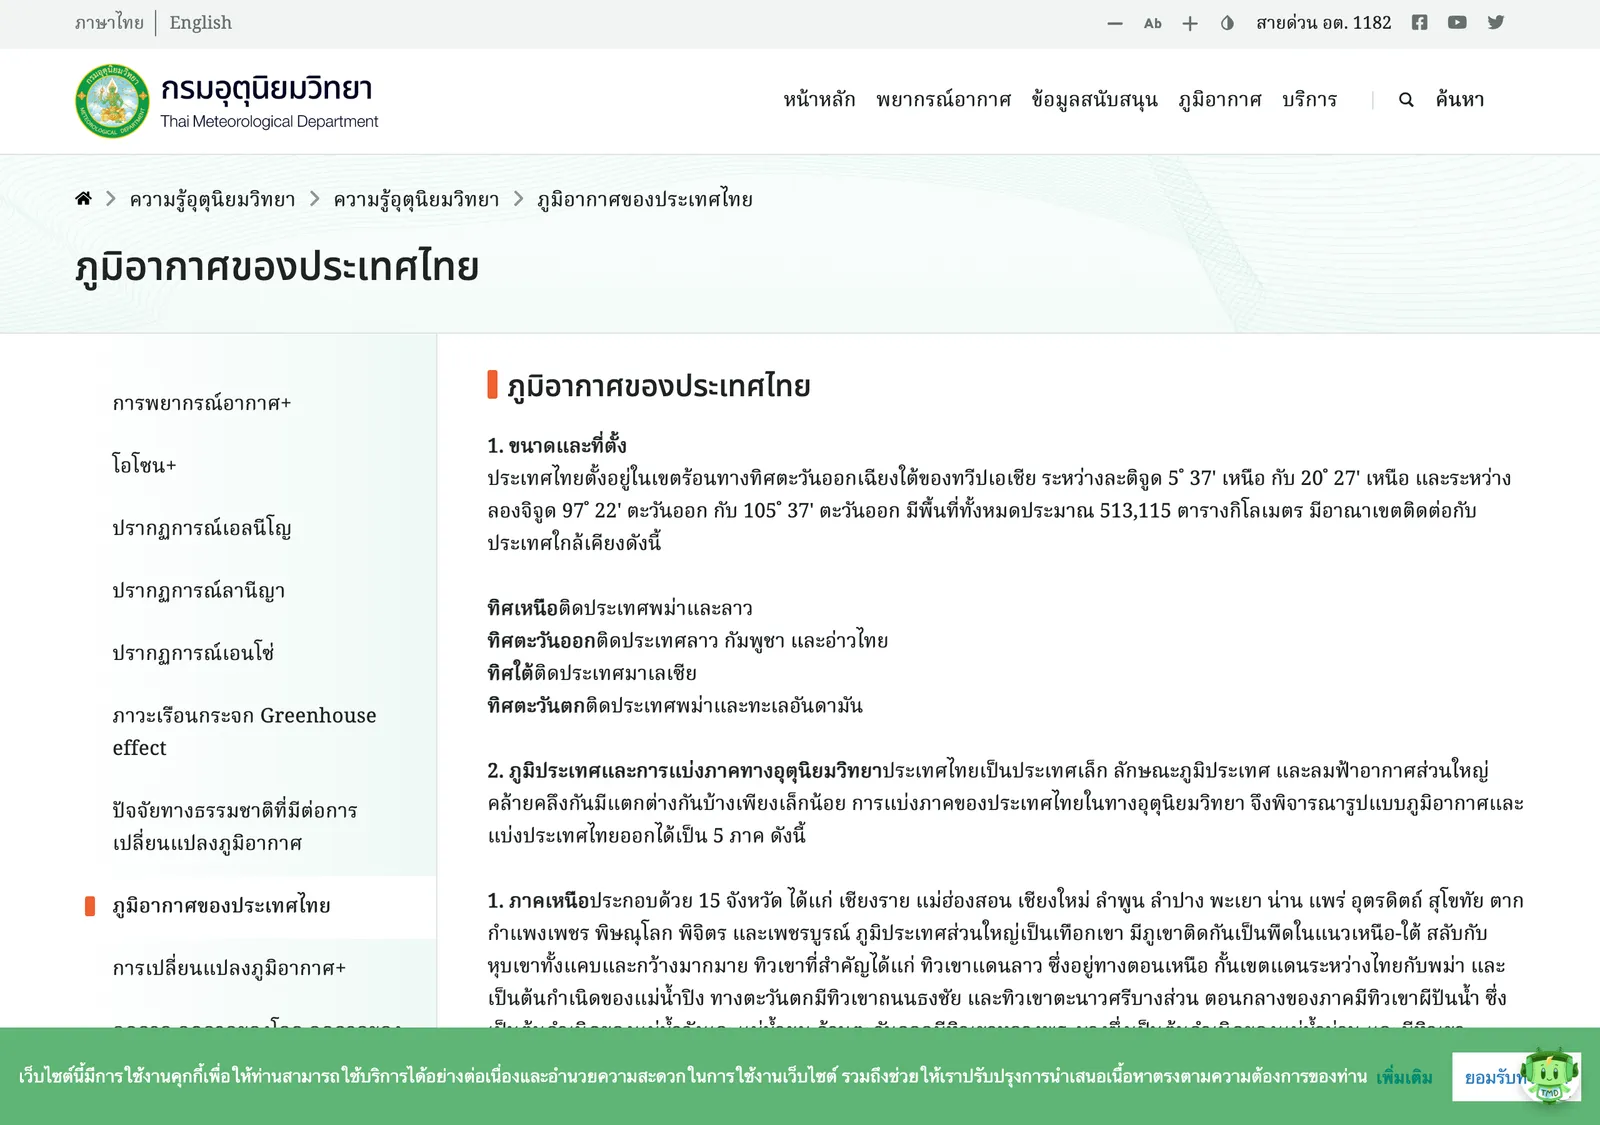
Two monsoons drive the rain. The southwest monsoon covers Thailand from mid-May to mid-October. It brings heavy cloud and rain, most of all along the coast and on mountains facing the wind.
The northeast monsoon runs from about mid-October to mid-February. It brings moisture from the Gulf of Thailand, so the south is rainy under it, especially the east side. Heavy rain in the south continues until December. The east side of the south gets more rain than the west side.
The two southern coasts face different seas. The Andaman Sea is on the west side of southern Thailand and the Gulf of Thailand on the east side. The west coast is Ranong, Phang Nga, Phuket, Krabi, Trang and Satun. Chumphon and Surat Thani are on the east coast.
These are normal dates. The start and end of both monsoons vary from them in any year. The rainy season can start 1 to 2 weeks early or late.
Rain by month and region
The table uses one TMD station per region and the climate normals for 1991-2020. Chiang Mai stands for the north, Khon Kaen for the northeast and Bangkok for the centre. Pattaya stands for the east, Koh Samui for the Gulf south and Phuket for the Andaman south. Each cell is the mean rain for that month in millimetres.
| Month | Chiang Mai (mm) | Khon Kaen (mm) | Bangkok (mm) | Pattaya (mm) | Koh Samui (mm) | Phuket (mm) |
|---|---|---|---|---|---|---|
| Jan | 11.3 | 6.0 | 23.6 | 16.3 | 126.8 | 49.9 |
| Feb | 9.6 | 17.3 | 21.4 | 19.9 | 64.3 | 24.0 |
| Mar | 20.4 | 38.0 | 51.0 | 47.3 | 115.8 | 80.7 |
| Apr | 54.3 | 94.6 | 93.3 | 67.9 | 82.9 | 135.1 |
| May | 167.5 | 155.0 | 216.8 | 121.1 | 131.6 | 236.9 |
| Jun | 118.2 | 145.7 | 198.5 | 132.1 | 133.6 | 249.4 |
| Jul | 148.6 | 177.9 | 189.7 | 103.6 | 117.0 | 240.2 |
| Aug | 223.3 | 222.2 | 227.1 | 91.2 | 102.2 | 308.7 |
| Sep | 207.2 | 246.0 | 335.9 | 213.6 | 117.5 | 350.4 |
| Oct | 123.8 | 102.1 | 288.7 | 224.5 | 294.9 | 336.0 |
| Nov | 40.9 | 21.5 | 44.6 | 56.6 | 444.6 | 178.2 |
| Dec | 14.1 | 5.1 | 11.6 | 11.7 | 263.1 | 82.0 |
| Year | 1139.2 | 1231.4 | 1702.2 | 1105.8 | 1994.3 | 2271.5 |
Phuket peaks in September at 350.4 mm. Koh Samui peaks in November at 444.6 mm. Phuket is driest in February at 24.0 mm. Koh Samui is driest in February at 64.3 mm.
North, northeast, centre and east
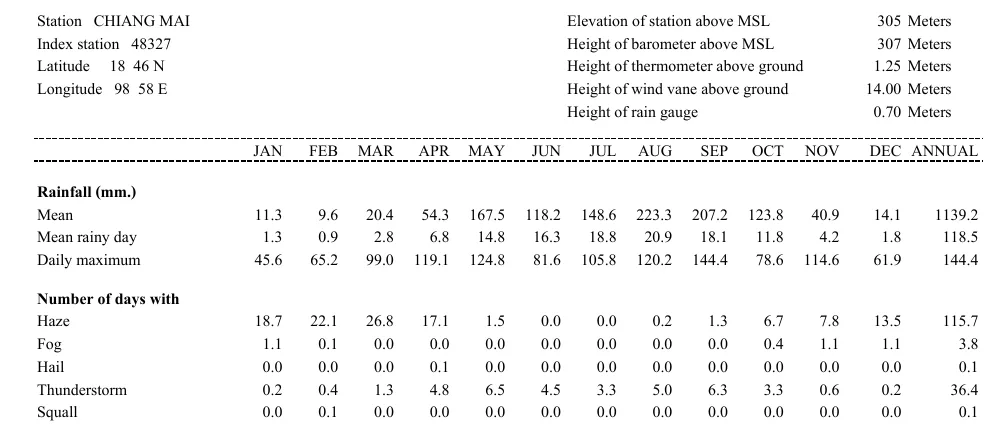
Chiang Mai peaks in August at 223.3 mm and drops to 9.6 mm in February. Khon Kaen peaks in September at 246.0 mm and falls to 5.1 mm in December.
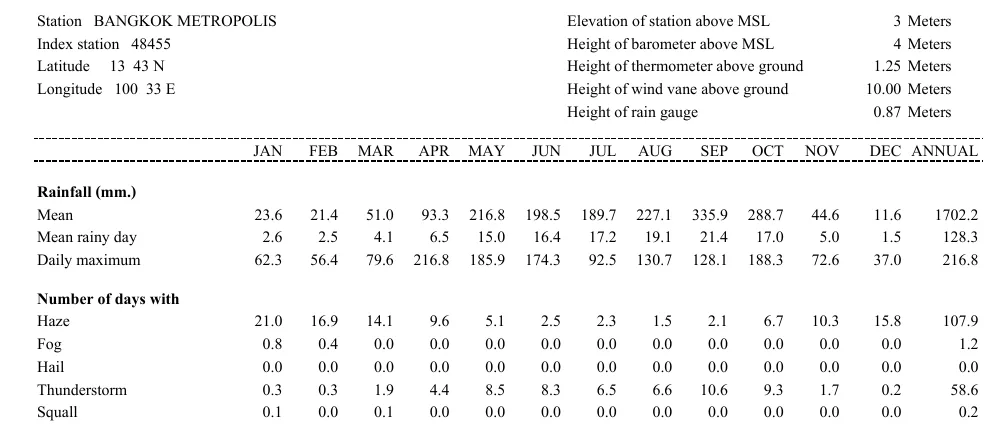
Bangkok peaks in September at 335.9 mm, with 288.7 mm in October. Its driest month is December at 11.6 mm. Pattaya peaks in October at 224.5 mm, with 213.6 mm in September.
Gulf coast: Koh Samui
Koh Samui’s wettest month is November at 444.6 mm, followed by October at 294.9 mm and December at 263.1 mm. From May to September the monthly rain stays between 102.2 mm and 133.6 mm. February is the driest month at 64.3 mm.
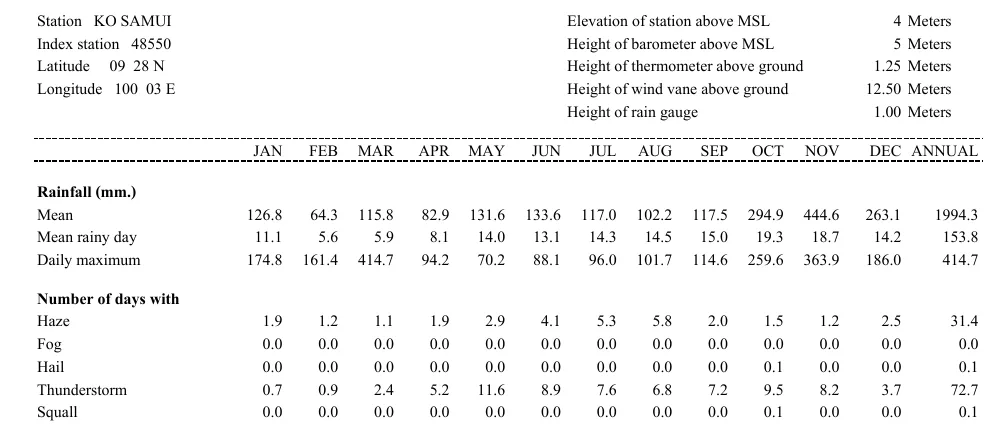
Koh Samui has 18.7 rainy days in November and 5.6 in February. A rainy day is a day with 0.1 mm or more of rain.
Andaman coast: Phuket
Phuket’s wettest month is September at 350.4 mm, followed by October at 336.0 mm and August at 308.7 mm. February is the driest month at 24.0 mm.
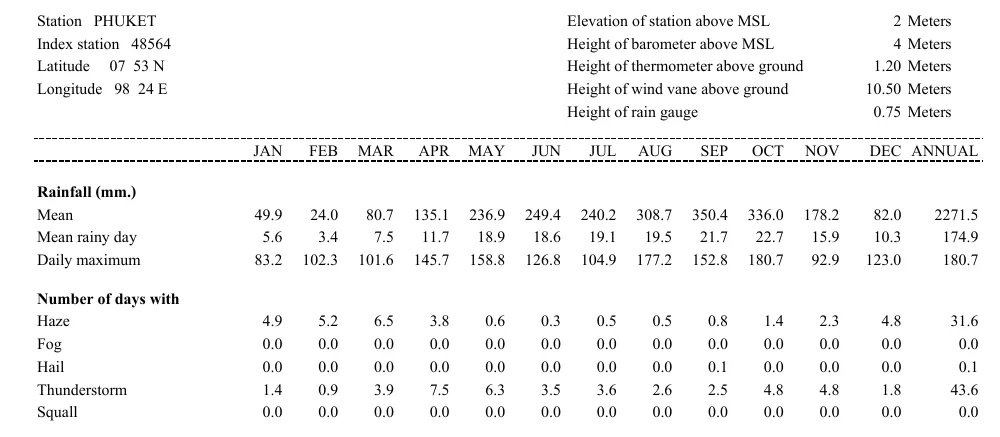
Phuket has 22.7 rainy days in October and 3.4 in February.
Heat and rainy days by region
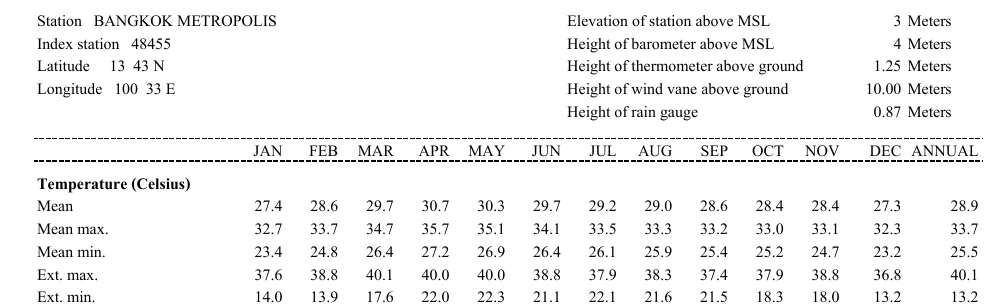
The hot season runs from mid-February to mid-May. Mean daily maximum peaks in April at 36.7 °C in Chiang Mai, 36.2 °C in Khon Kaen, 35.7 °C in Bangkok and 33.0 °C in Pattaya. Phuket peaks in March at 34.4 °C and Koh Samui in May at 32.9 °C.
| Station | Rain a year (mm) | Rainy days a year | Hottest month (°C) | Coolest month (°C) |
|---|---|---|---|---|
| Chiang Mai | 1139.2 | 118.5 | Apr 36.7 | Dec 29.2 |
| Khon Kaen | 1231.4 | 108.5 | Apr 36.2 | Dec 30.3 |
| Bangkok | 1702.2 | 128.3 | Apr 35.7 | Dec 32.3 |
| Pattaya | 1105.8 | 106.1 | Apr 33.0 | Dec 30.2 |
| Koh Samui | 1994.3 | 153.8 | May 32.9 | Jan 29.0 |
| Phuket | 2271.5 | 174.9 | Mar 34.4 | Sep 31.8 |
The coolest month is December at Chiang Mai with 29.2 °C and at Bangkok with 32.3 °C. Koh Samui is coolest in January at 29.0 °C. Phuket’s mean daily maximum ranges from 31.8 °C to 34.4 °C across the year.
Rainy days add up to 174.9 a year in Phuket, 153.8 on Koh Samui and 128.3 in Bangkok. Chiang Mai has 118.5, Khon Kaen 108.5 and Pattaya 106.1.
Northern haze and the burn ban
Chiang Mai records haze on 18.7 days in January, 22.1 in February, 26.8 in March and 17.1 in April. Haze days fall to 1.5 in May and 0.0 in June. These are TMD observer counts of haze, a weather condition, not PM2.5 readings.
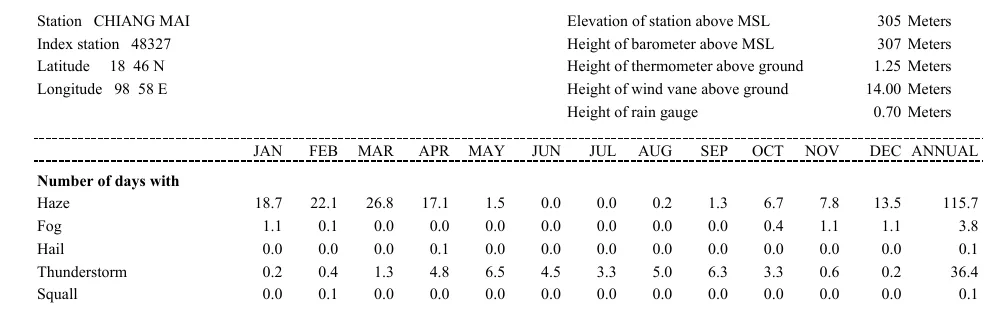
Khon Kaen records 22.5 haze days in January and in March. Bangkok records 21.0 haze days in January.
PM2.5 and the burning ban
Thailand’s 24-hour PM2.5 standard is 37.5 micrograms per cubic metre or less from 1 June 2023. The Pollution Control Department index puts 25.1 to 37.5 at AQI 51 to 100, yellow. A reading of 75.1 and above is the top band, red.
On 1 April 2026 a Chiang Mai station reported PM2.5 of 110.3 micrograms per cubic metre. Air4Thai (air4thai.pcd.go.th and the Air4Thai app) is where a Pollution Control Department office points readers for air quality reports.
Chiang Mai province banned open burning in all areas until 31 May 2026. The 2026 “Chiang Mai does not burn” request runs from 1 January to 31 May. In 2025 the provincial police described the ban as running from 1 January to 15 May.
A 2025 police summary lists up to 3 months in jail or a fine of up to THB 25,000, or both, for open burning that causes a nuisance.
Marine park closures by month
The Department of National Parks closes island parks on set dates each year. The table reads the 2026 Gazette annex month by month for the island parks readers ask about.
| Month | Island parks closed in the 2026 annex |
|---|---|
| May | Similan Islands and Surin Islands from 16 May |
| June | The May list, plus Koh Rok, Tarutao (Adang, Rawi) and Hat Chao Mai (Koh Cheuk, Koh Waen) from 1 June |
| July | The June list, plus Koh Kudi at Koh Samet from 1 July |
| August | The July list, plus Maya Bay, Phang Nga Bay islands and Koh Ha from 1 August; Koh Kudi until 15 August, Koh Talu from 16 August |
| September | The August list until 30 September, with Koh Talu in place of Koh Kudi |
| October | Similan Islands and Surin Islands until 14 October |
| November | Ang Thong Islands in the Gulf from 1 November |
| December | Ang Thong Islands until 15 December |
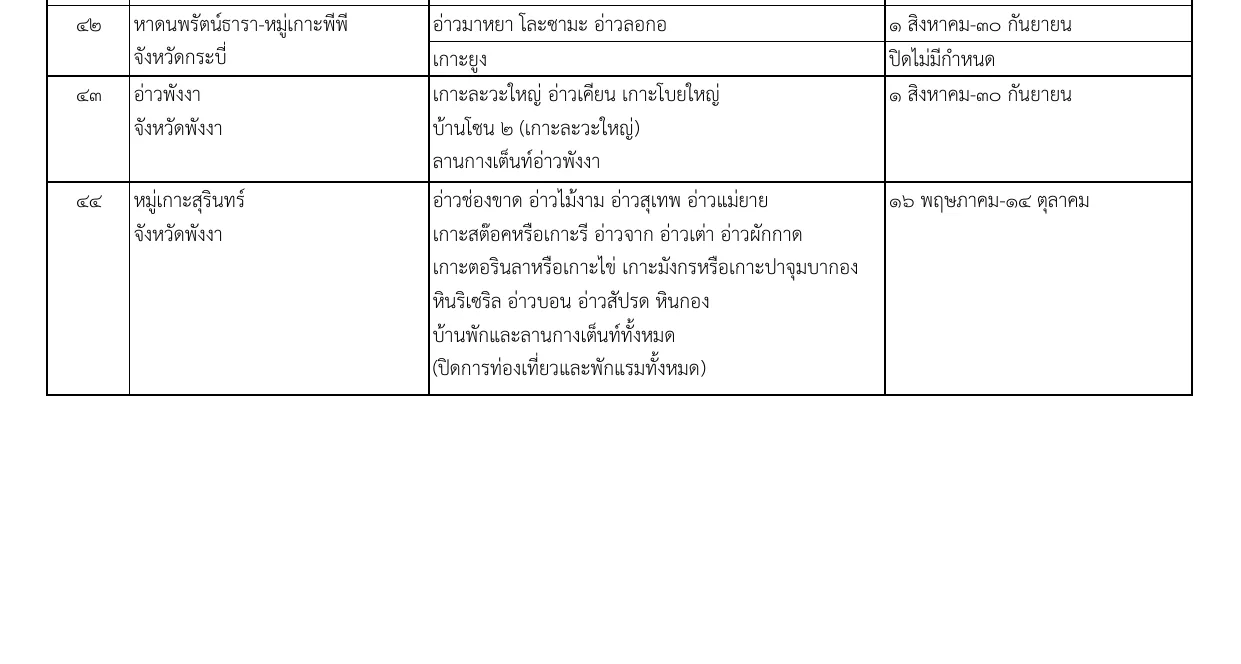
Maya Bay, Loh Samah and Lo Ko bay on Phi Phi are closed 1 August to 30 September. Koh Rok closes 1 June to 30 September. Koh Ha and Hin Muang-Daeng close 1 August to 30 September.
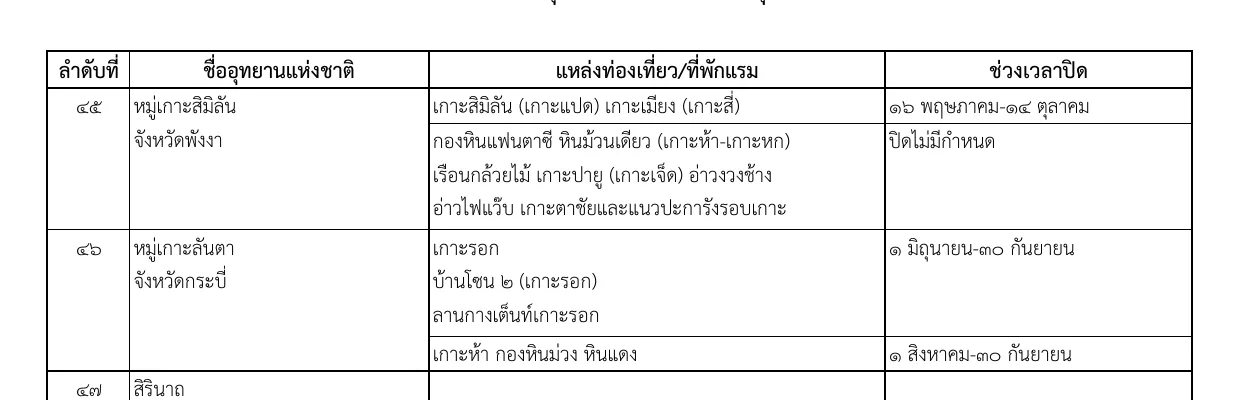
Tarutao closes Adang, Rawi and other listed islands from 1 June to 30 September. Hat Chao Mai closes Koh Cheuk and Koh Waen from 1 June to 30 September. Koh Samet closes Koh Kudi from 1 July to 15 August and Koh Talu from 16 August to 30 September.
Planning around the dates
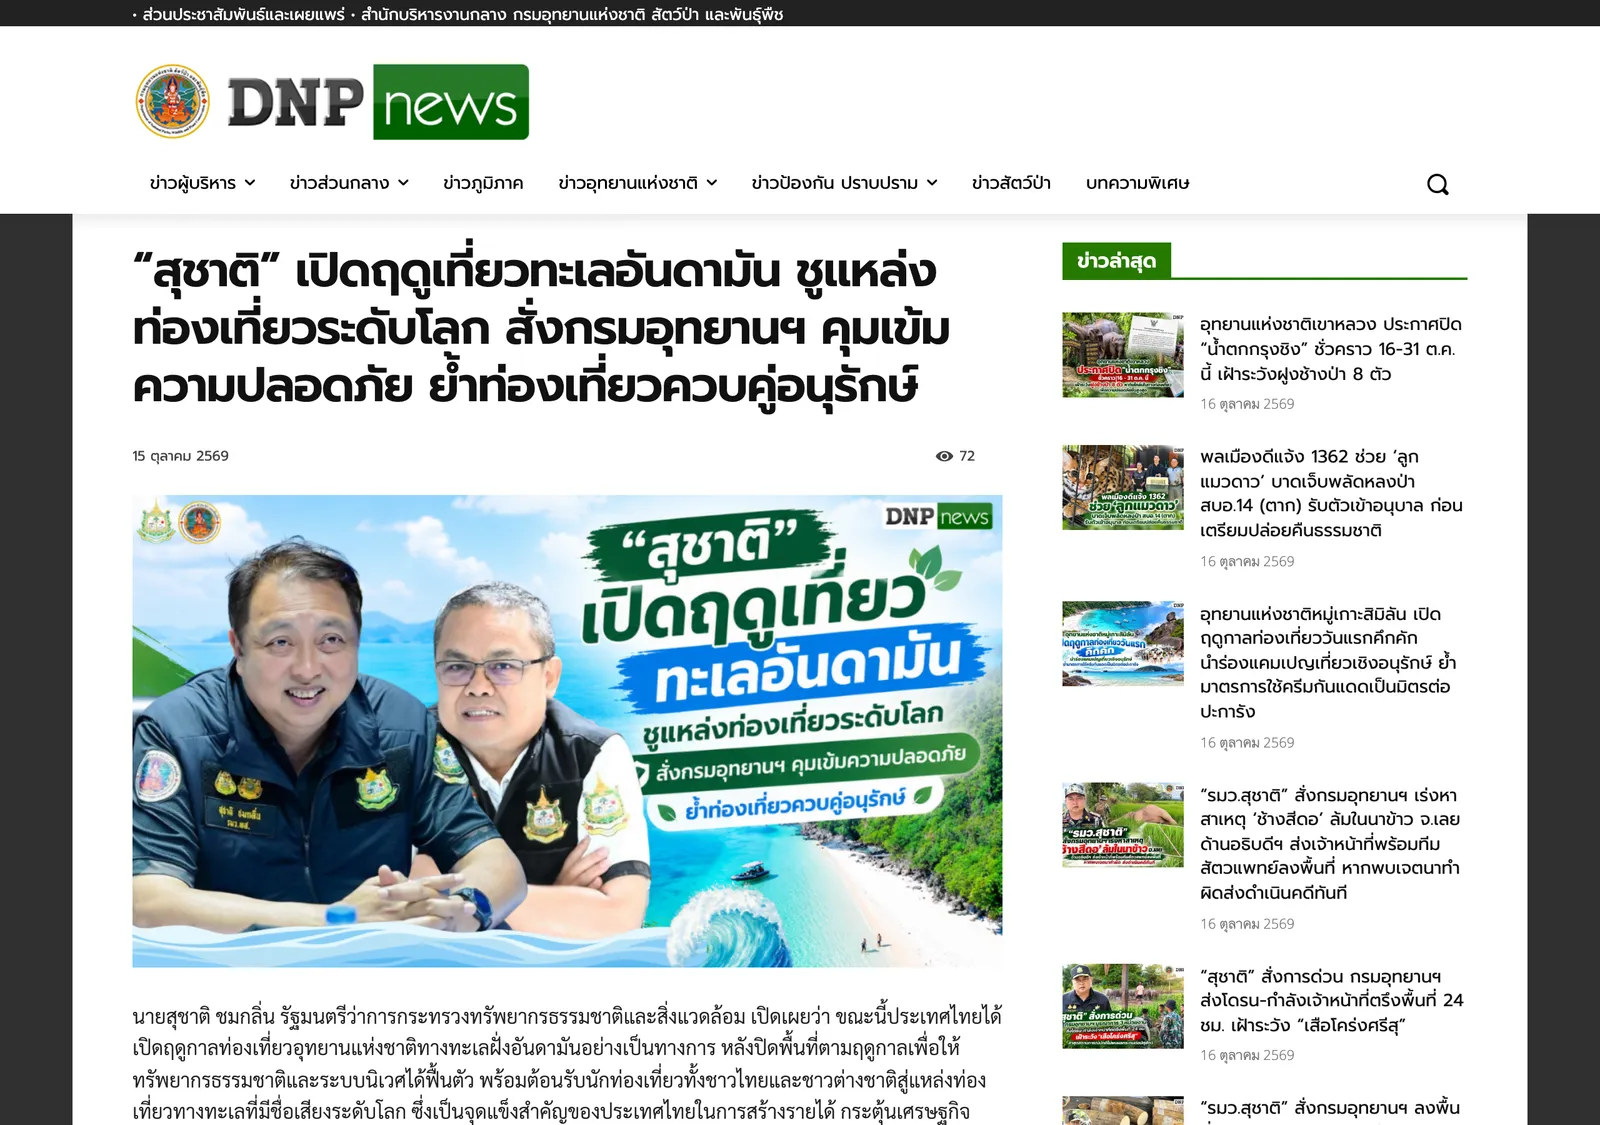
The Similan Islands park opened for the season on 15 October 2026. The Andaman marine parks, including Similan, Surin, Phi Phi, Lanta and Phang Nga Bay, have opened for the season. Opening of some sites can change with the weather.
Use the tables like this:
- Late October to December: the Gulf side is the wetter coast. Koh Samui gets 294.9 mm in October and 444.6 mm in November, Phuket 336.0 mm and 178.2 mm.
- January to March: Phuket gets 49.9 mm, 24.0 mm and 80.7 mm. Koh Samui gets 126.8 mm, 64.3 mm and 115.8 mm.
- April and May: Bangkok reaches 35.7 °C in April and Chiang Mai 36.7 °C. Phuket rain climbs from 135.1 mm in April to 236.9 mm in May.
- June to September: Phuket gets 249.4 mm, 240.2 mm, 308.7 mm and 350.4 mm. Koh Samui stays between 102.2 mm and 133.6 mm.
The driest part of the upper east coast of the south is behind the Tenasserim range, in Phetchaburi and Prachuap Khiri Khan. See the Hua Hin guide for that stretch.
For month-by-month island advice read Best Thai Islands by Month. For stings and flags in the wet months read jellyfish and rip currents. For park entry rates read national park fees. Bases: Phuket, Koh Samui, Chiang Mai.
Not confirmed: Each region is one TMD station, so a resort away from that station gets different rain. The closure table lists the island parks covered here, not the full Gazette annex.
Common questions
What is the best month to visit Thailand?
It depends on the coast. Phuket is driest in February at 24.0 mm, Koh Samui also in February at 64.3 mm and Bangkok in December at 11.6 mm.
When is the rainy season in Thailand?
The rainy season runs from mid-May to mid-October. The south stays rainy until December.
Which month is wettest in Phuket?
September, with 350.4 mm on average, then October with 336.0 mm.
Which month is wettest on Koh Samui?
November, with 444.6 mm on average, then October with 294.9 mm.
How hot is Bangkok in April?
The mean daily maximum in April is 35.7 °C, the hottest month of the year.
When is the smoky season in Chiang Mai?
Chiang Mai has 18.7 haze days in January, 22.1 in February, 26.8 in March and 17.1 in April. The 2026 no-burning request for Chiang Mai ran from 1 January to 31 May.
When do the Similan Islands close?
The Similan Islands close from 16 May to 14 October. The park opened for the 2026 season on 15 October.
Do the monsoon dates change each year?
The start and end of both monsoons vary from the normal dates in any year. The rainy season can start 1 to 2 weeks early or late.
What counts as a rainy day in the TMD tables?
A day with 0.1 mm or more of rain.
Read next
Prices, timetables and opening hours change; check with the operator before you travel. See how guides are checked.
Spotted an error? Report it.